
Downtown Richmond, VA Development & Growth
Downtown Richmond has continued to be the leading driver for economic value, creativity and innovation for the entire Richmond Region.
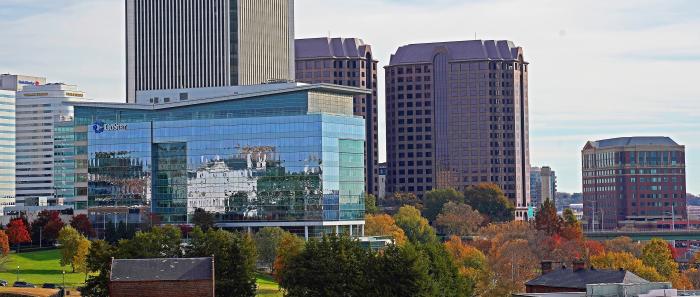
Virginia’s capital city is booming.
From 2019-2022 more than 75 development projects totaling $3.6 billion have been completed or are underway in the Downtown Master Plan area of the City.
Since 2000, Downtown has also absorbed nearly half of the city's population growth, become the uncontested economic center of Richmond and has a remarkable concentration of the city's real estate and cultural assets.
Downtown Richmond is a clear leader in population growth, share of citywide jobs, assessed values and share of citywide retail sales.
$3.6 Billion+ of Investment in Downtown Richmond, VA
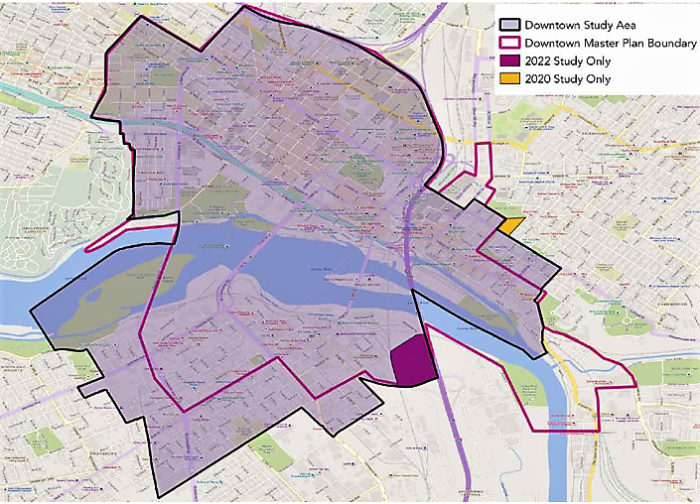
Downtown makes up a small share of the City’s land area but has substantial economic impact
Downtown sits on 3.2 square miles of the City, which is just 5% of the City land and has a land value of over $3 billion per square mile compared to $0.56 billion for the City and $0.065 billion per square mile for the region. Downtown also has a remarkable concentration of the City’s real estate assets:
- 25% of residential units*
- 27% of retail square footage*
- 76% of office square footage*
Assessed Property Value Downtown*
- $3 billion in assessed property values per square mile
- 35% of the city’s total assessed value
- 27% of all real estate value in Richmond is located downtown
- $15.2 billion increase (160%) in the taxable real estate assessments (2000-2019)
- $143 million increase (130%) in the real Estate tax revenues (2000-2019)
- $21.3 million increase (50%) in personal property tax revenues (2000-2019)
* Source: International Downtown Association Research on Richmond for “The Value of U.S. Downtowns and Center Cities,” 2020
Office Downtown**
- 6.5% office vacancy rate in 2022
- $23.25psf average Class A office rents
- 76% of office space in the city is located downtown
- 2,800 locally owned businesses, which accounts for 34% of local businesses citywide
Job Growth**
- Since 2002, Downtown Richmond has seen strong 9% job growth
- Downtown is home to 50% of all jobs in the city
Retail Vacancy Rate**
- Retail vacancy rate of 2.7% in 2022; down from a 5.3% vacancy rate in 2020
Retail Sales**
- $526 million total annual downtown retail sales in 2019
- 22% of all city-wide retail sales is downtown; 33.3% is represented by restaurants
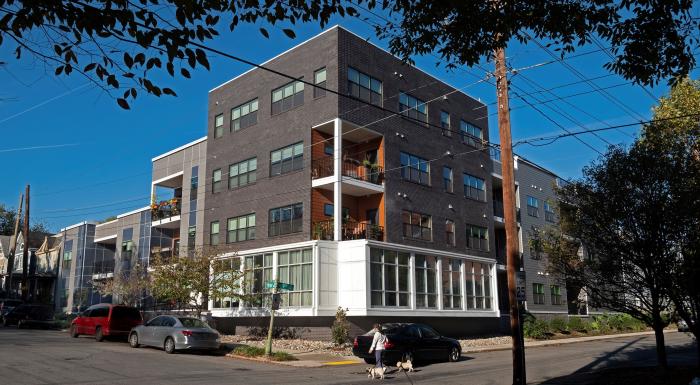
Residential Growth Downtown**
-
21,600 total residential population in 2020 120% growth puts Richmond in the top echelons of downtown residential growth among its peers (2000-2022)
-
6th ranked of all IDA study downtowns in population growth (2000-2022)
-
9.4% of the city’s total population (residential numbers include students who live off-campus downtown but exclude anyone living in group quarters such as dorms)
-
3.2 square miles absorbed 22% of all of the city’s population growth from 2010-2020
-
45% increase in downtown residents between 2010 and 2020, nearly four times the population growth rate of the entire city over that period^
-
57% increase in residential housing units downtown between 2010 and 2020^
-
70% of the residents are between 18-34 years old^
-
$46,489 median household income (2020)
-
14% of housing units are owner-occupied (2020)
-
$1,182 median gross rent (average rent in Richmond, VA in 2020)
-
28% median gross rent increase (2010-2020)
^ According to 2020 data from the U.S. Census Bureau. This report data is bound by Belvidere St, the James River, and Interstate 64/95—encompassing Jackson Ward, Monroe Ward, the Financial District and Shockoe Slip. The data does not include Shockoe Bottom and Manchester neighborhoods
Venture Richmond’s Economic Impact in the Region***
-
$58M in total economic impact by Venture Richmond
-
542 jobs created by Venture Richmond’s activity
-
$3.3M generated in state and local revenues through Venture Richmond’s activity
*** ECONOMIC IMPACT ANALYSIS OF VENTURE RICHMOND ACTIVITIES AND ASSOCIATED SPENDING, conducted by VCU Center for Urban and Regional Analysis, Nov. 2020
